 淇淇有料
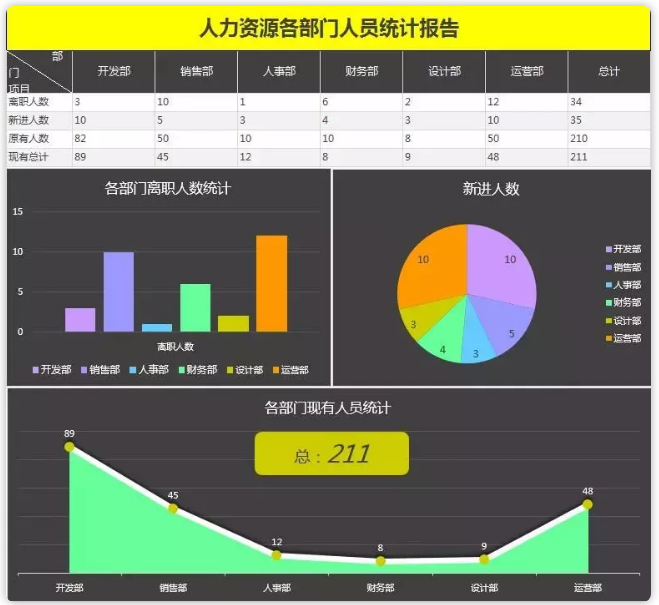
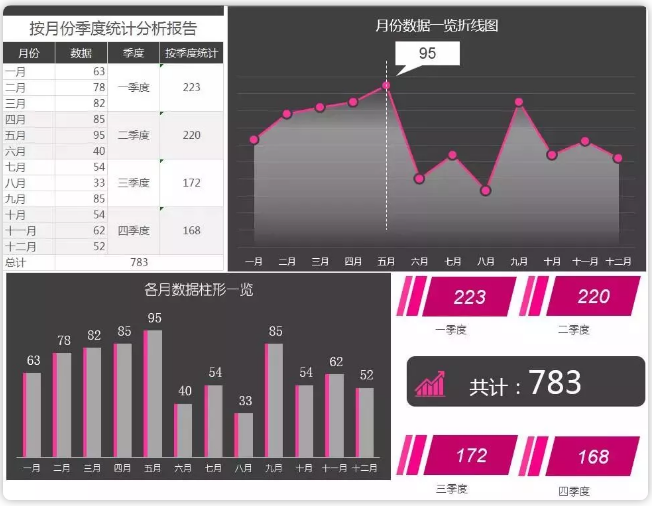
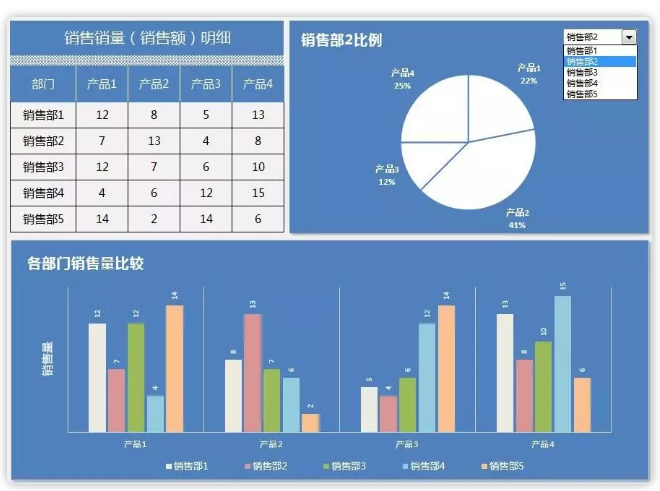
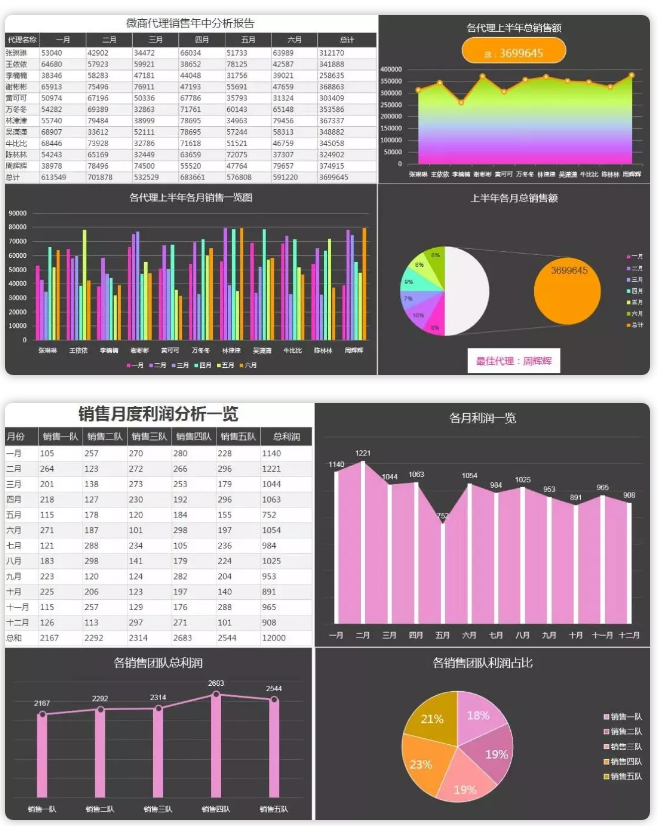
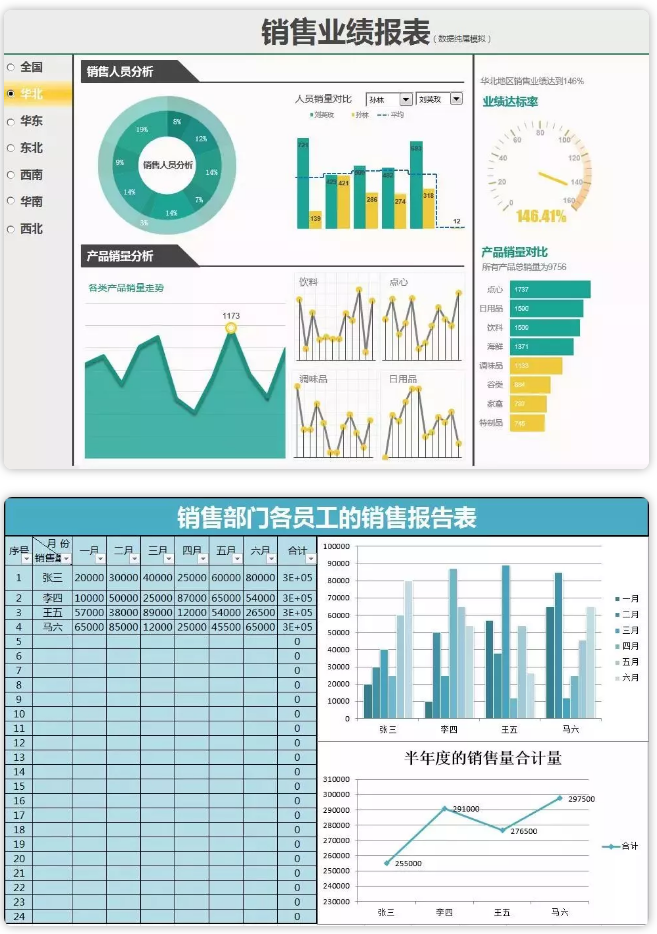
淇淇有料很多人都会用Excel,然而,在操作Excel过程中,我们经常会对一列数据进行分析,但要知道的是,看到冰冷的数字,我们是没有感觉的,只有将数字进行图形化,印象才会比较深刻,这时候就要用到Excel可视化图表。
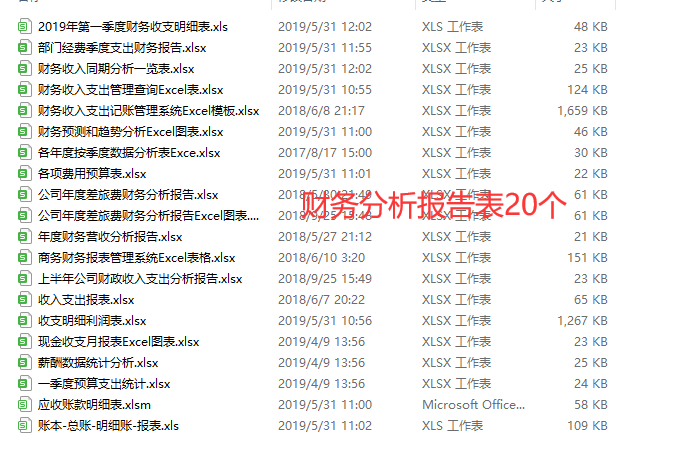
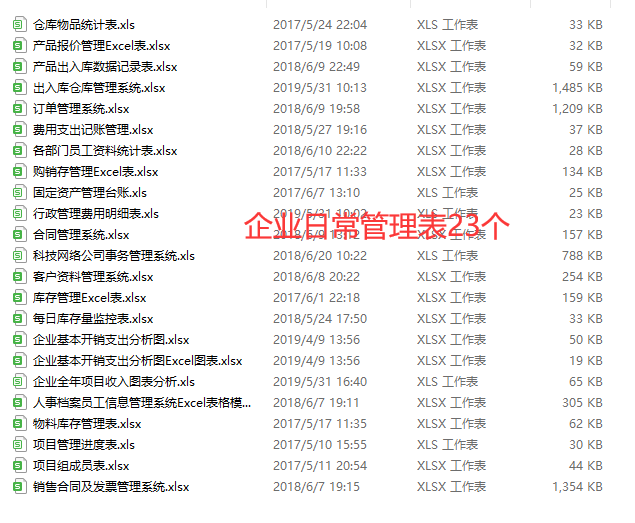
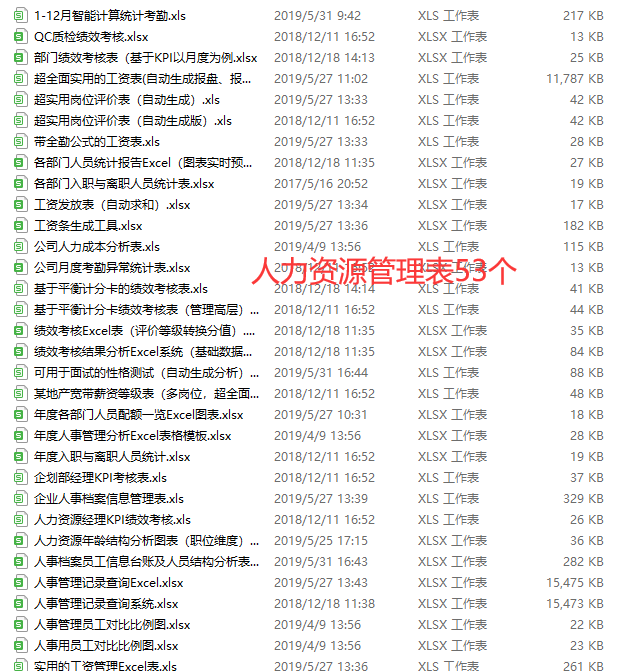
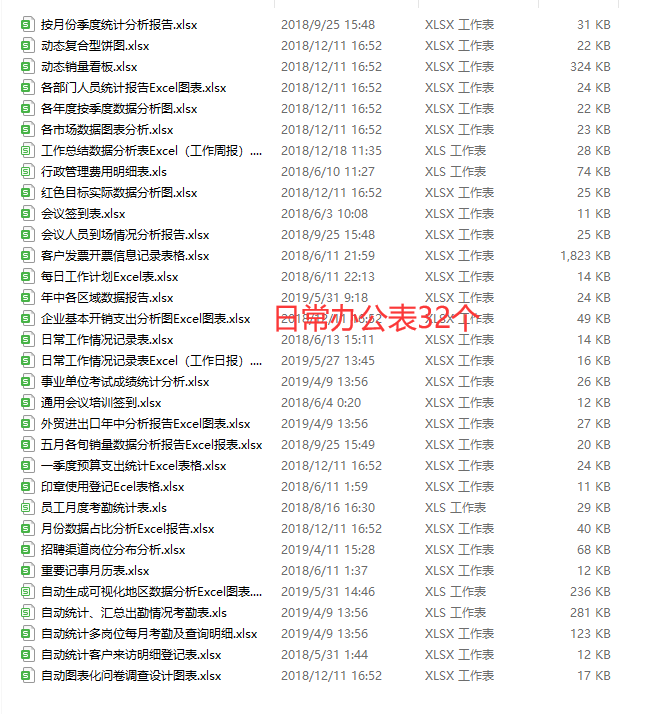
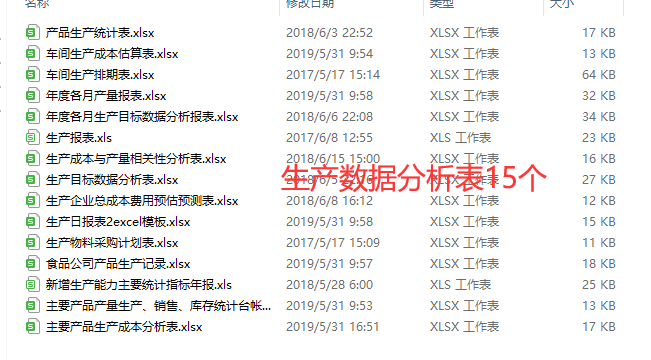
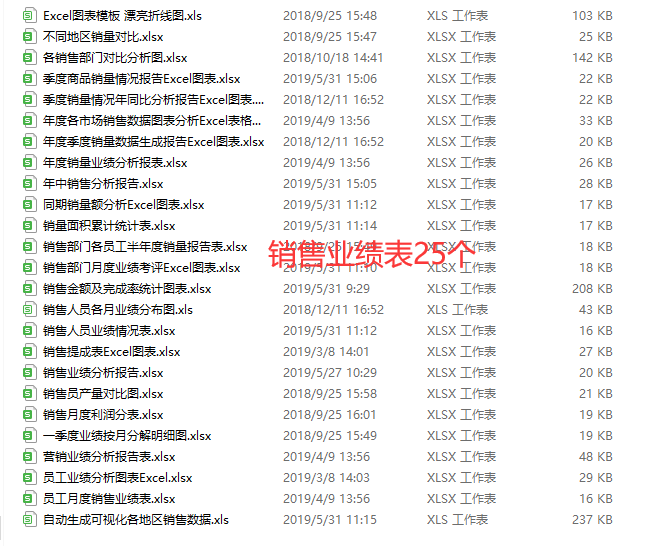
这套图表都是日常办公经常用到的,包括:财务分析报告表、企业日常管理表、人力资源管理表、日常办公报表、生产数据分析表、销售业绩表。
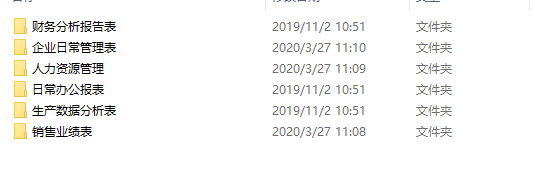
部分目录如下:
部分图表效果图:
下载地址:
下载说明:
在下载页面点击“普通下载”即可,可能会弹出第三方广告页面,请忽略。 详细下载教程请点这里:本站下载教程
电子书格式转换及格式科普请点这里:电子书格式